An Introduction to Cypress Testing

Cypress is an open source, free test automation tool that can test anything that utilizes JavaScript and runs on a web browser. Developed by Drew Lanham, Cypress is mostly used to test front-end operations.
Given that Cypress requires working on JavaScript with a web browser, familiarity and ease with JavaScript is advisable.
Contrary to popular belief among code testers, cypress does not use selenium. It interacts directly with a web browser, making it faster and more reliable. To know more about Cypress and its installation, visit Cypress.io
Here's your 101 guide to Cypress testing
Features of Cypress
Here are a few key features of Cypress-
- Cypress is supported by web browsers like Google Chrome, Firefox, Edge, Electron, and Brave.
- Cypress lets you take snapshots as your test runs. You can view the command log after the test has been run to assess the test results.
- Effortless error reading and stack trace.
- Hassle-free checks and management of network traffic.
- Cypress works directly with the web browser and doesn't Web Driver or Selenium to get consistent results.
- It offers local cross-browser testing along with remote cross-testing on a cloud server.
Installing cypress
Compared to other testing tools, installing Cypress is rather simple. It can be installed using two distinct approaches.
- Command line tool
- Desktop app
You might need to download tools like Node.js & NPM (Node Package Manager) before you initiate the installation process for Cypress.
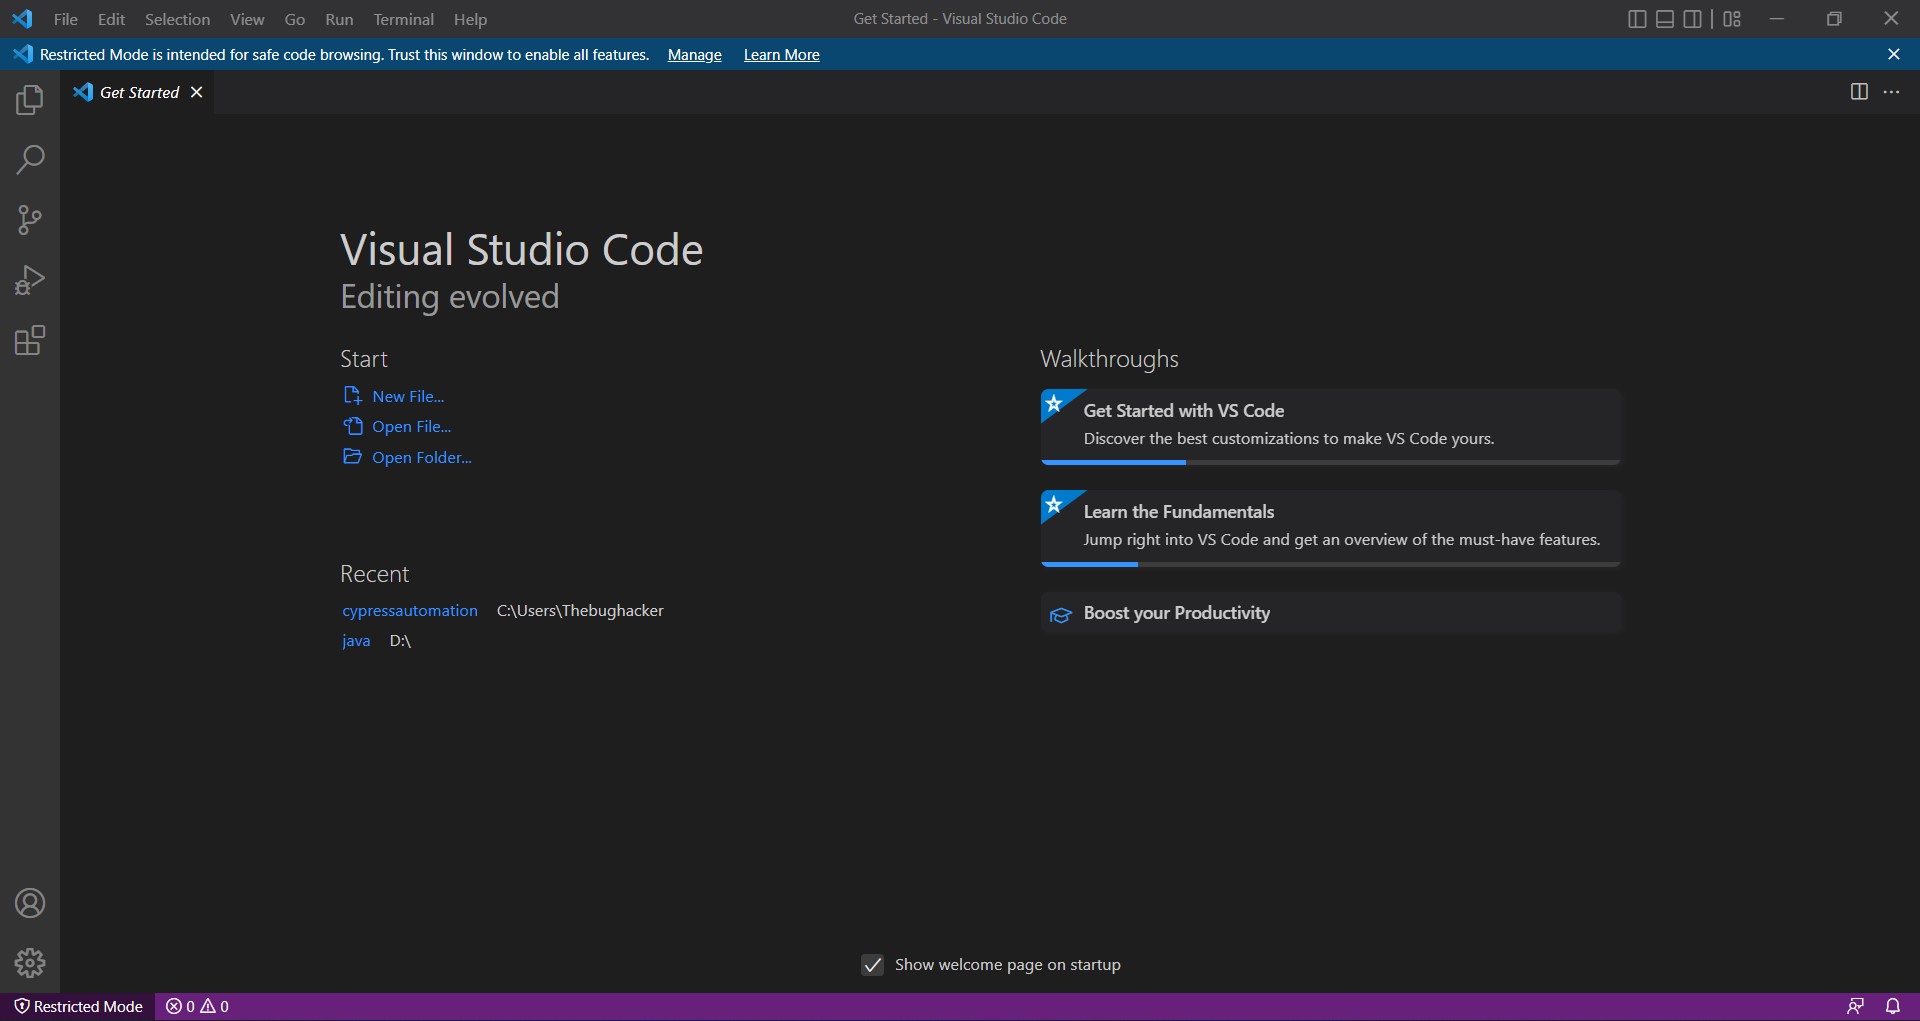
A Visual Studio Code will launch on your screen once the setup file has been downloaded and the installation completed.
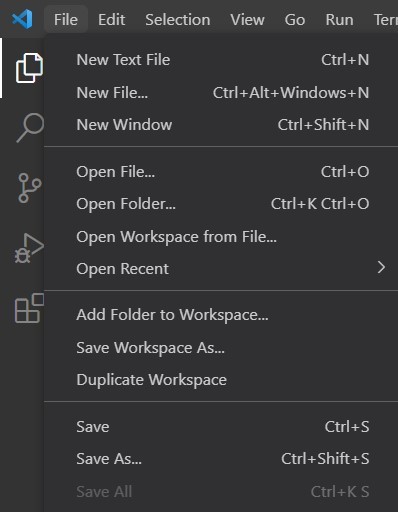
Create a folder where you can store your test cases. Make a new file by selecting New from the file menu and giving it a name, for example: cypressautomation.
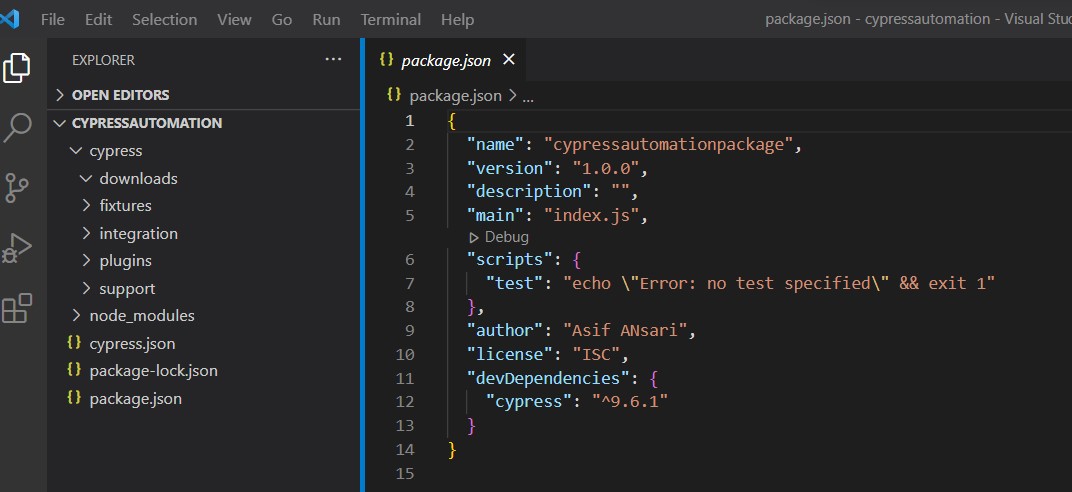
After opening the file, all the created files (created during the installation process) will be displayed on the left panel.
Setting up tests
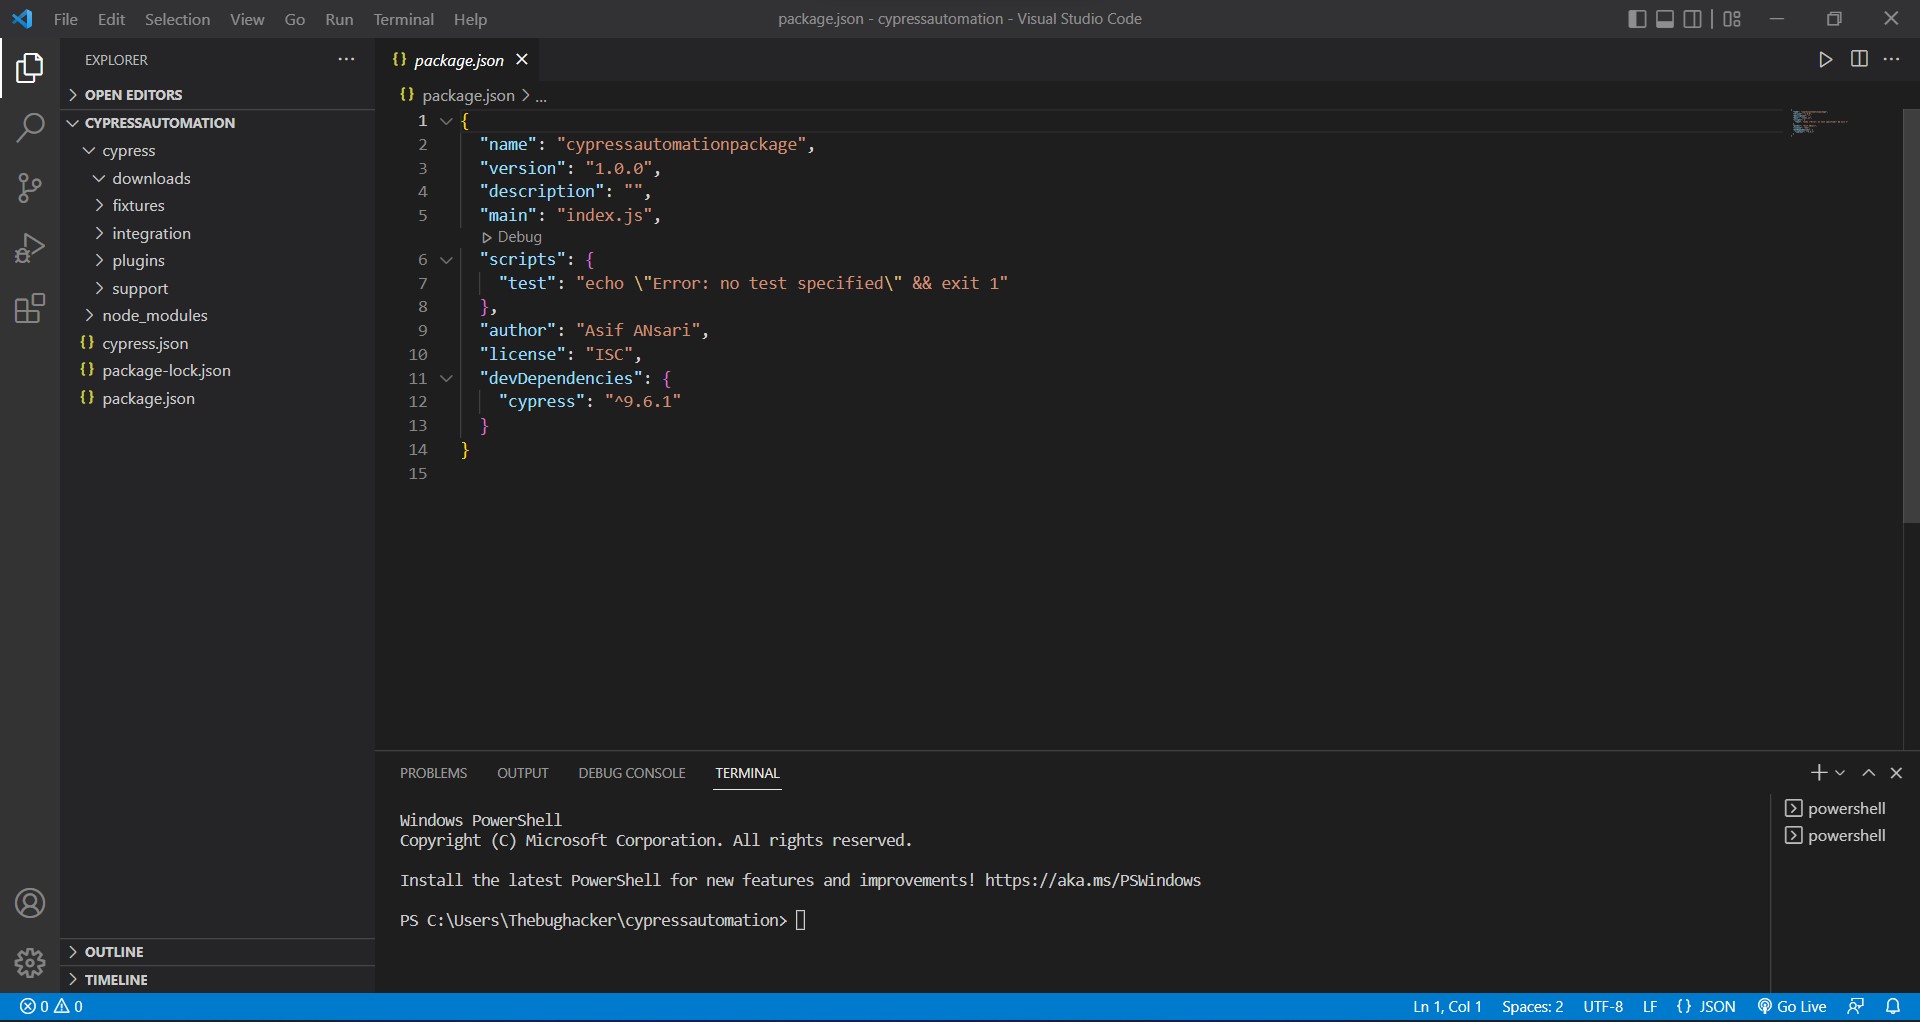
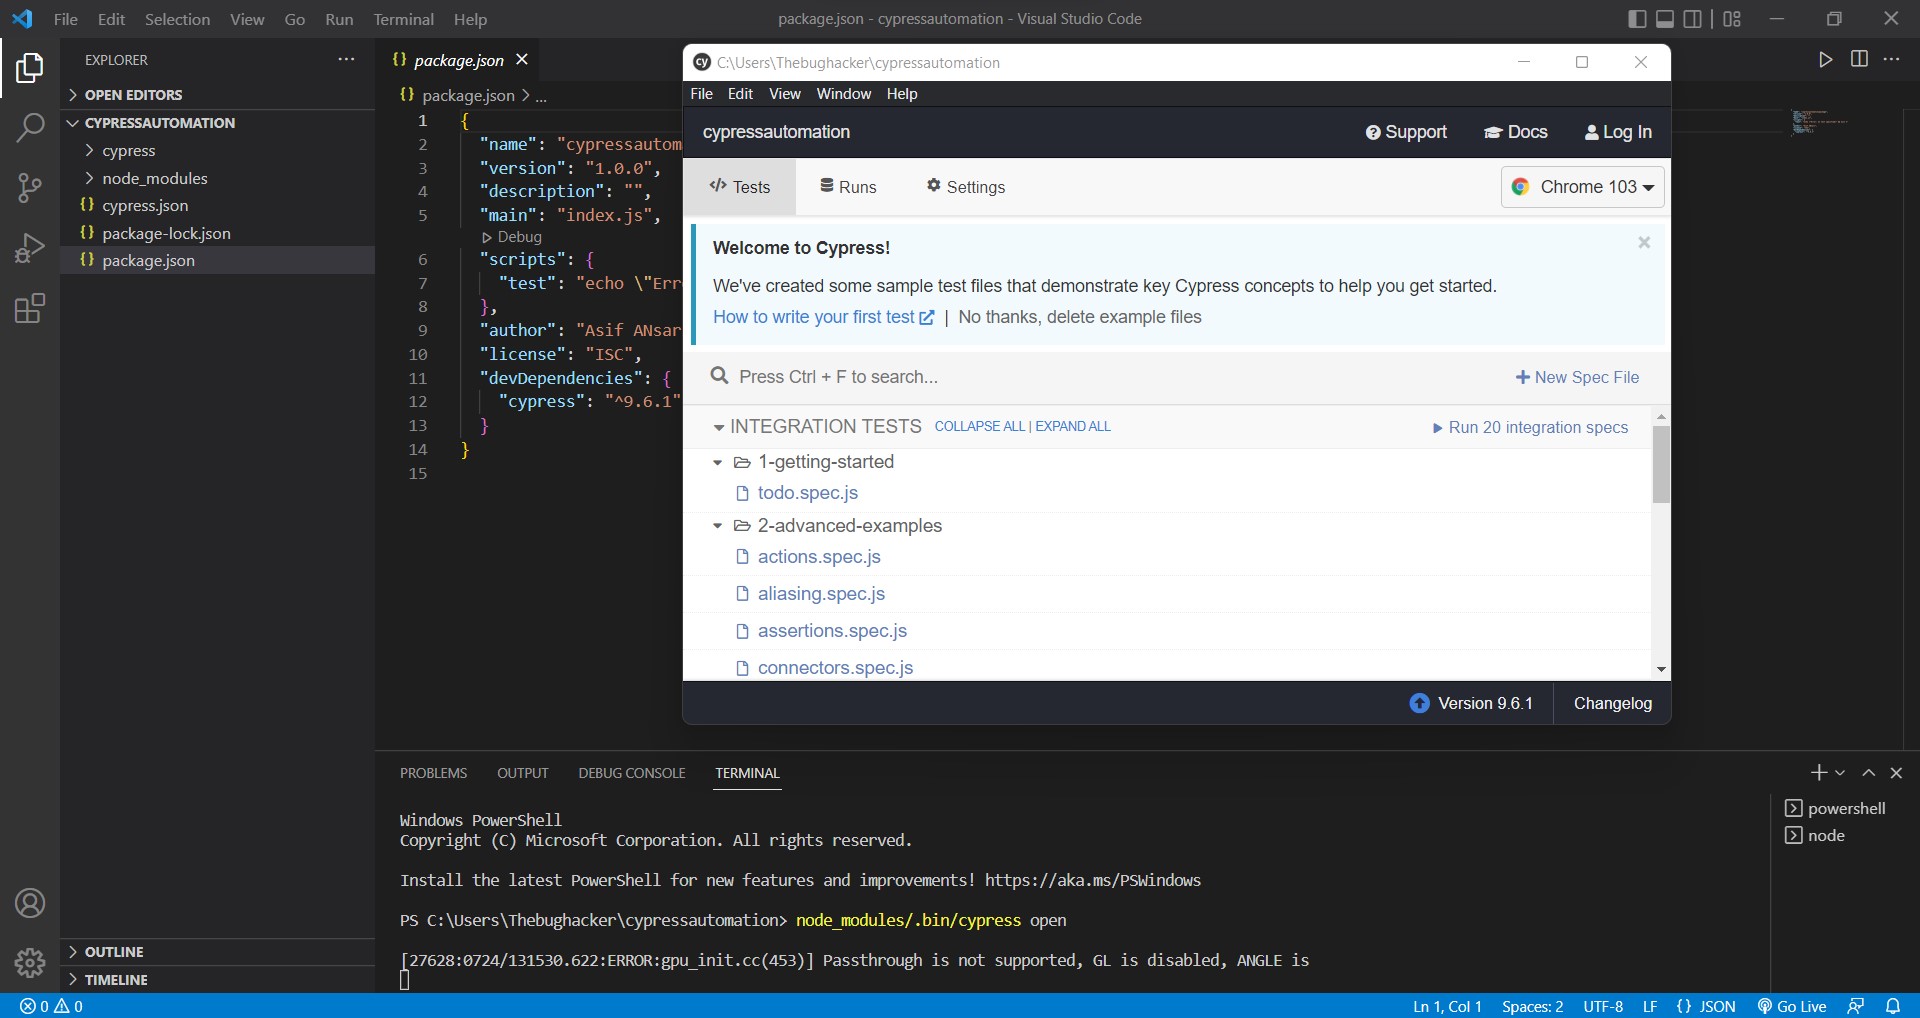
You can start a test case's execution with the aid of a test runner. You can use the visual studio code terminal or the command prompt on your computer/laptop to launch the test runner. Let’s use the Visual Studio Terminal as an example.
In the menu bar, there is an option to launch the terminal. Simply click and choose the new terminal. A new panel will appear at the bottom.
To open the test runner enter the command as mentioned below:
Command: node_modules/.bin/cypress open
It might take 3-5 seconds for the test runner to open, once the command is entered. A new pop-up window will appear.
Writing test cases
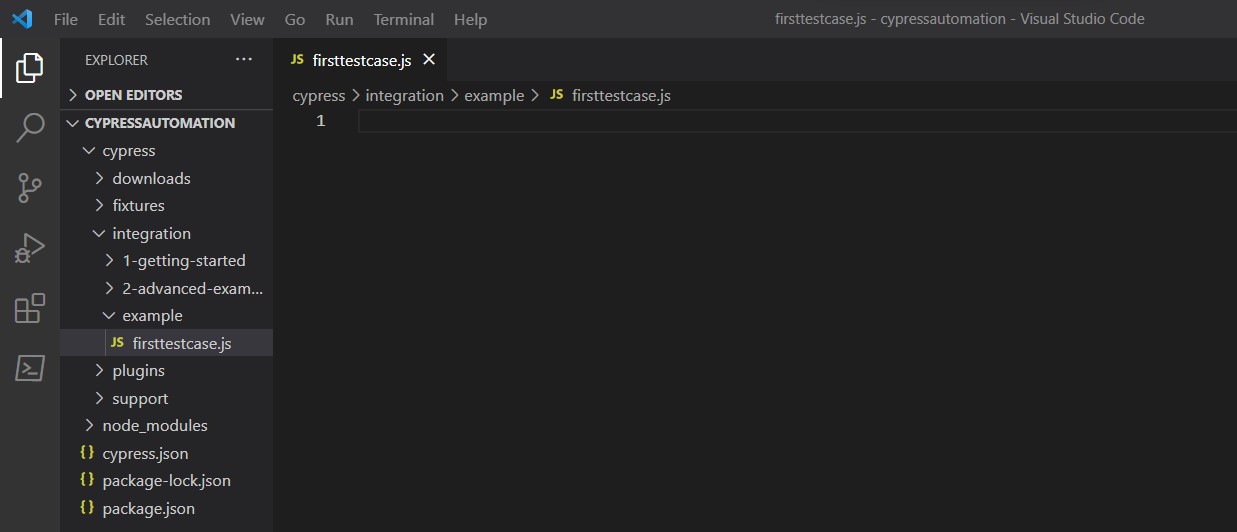
It is necessary to create a file under Cypress=>Integration=>example before beginning to write our test cases.
For example, firsttestcase.js can be a file under which you write and curate your first test case.
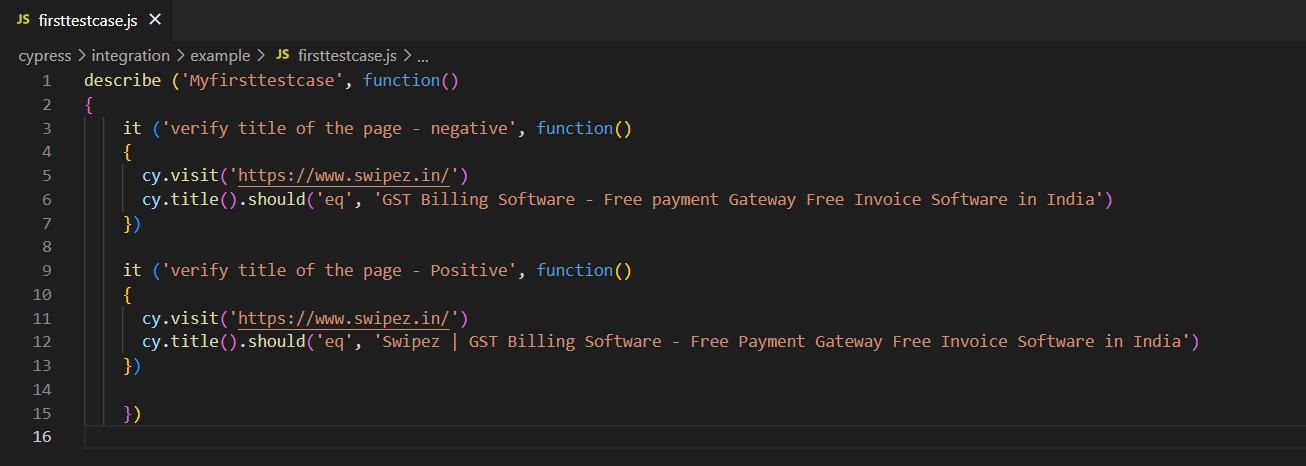
Now the question arises as to how to write the test cases? Not to worry, here's a test case structure you can follow
( ‘test suite’,function() {
it ('Test case1', function()
{steps
})
it ('Test case2', function()
{steps
})
})
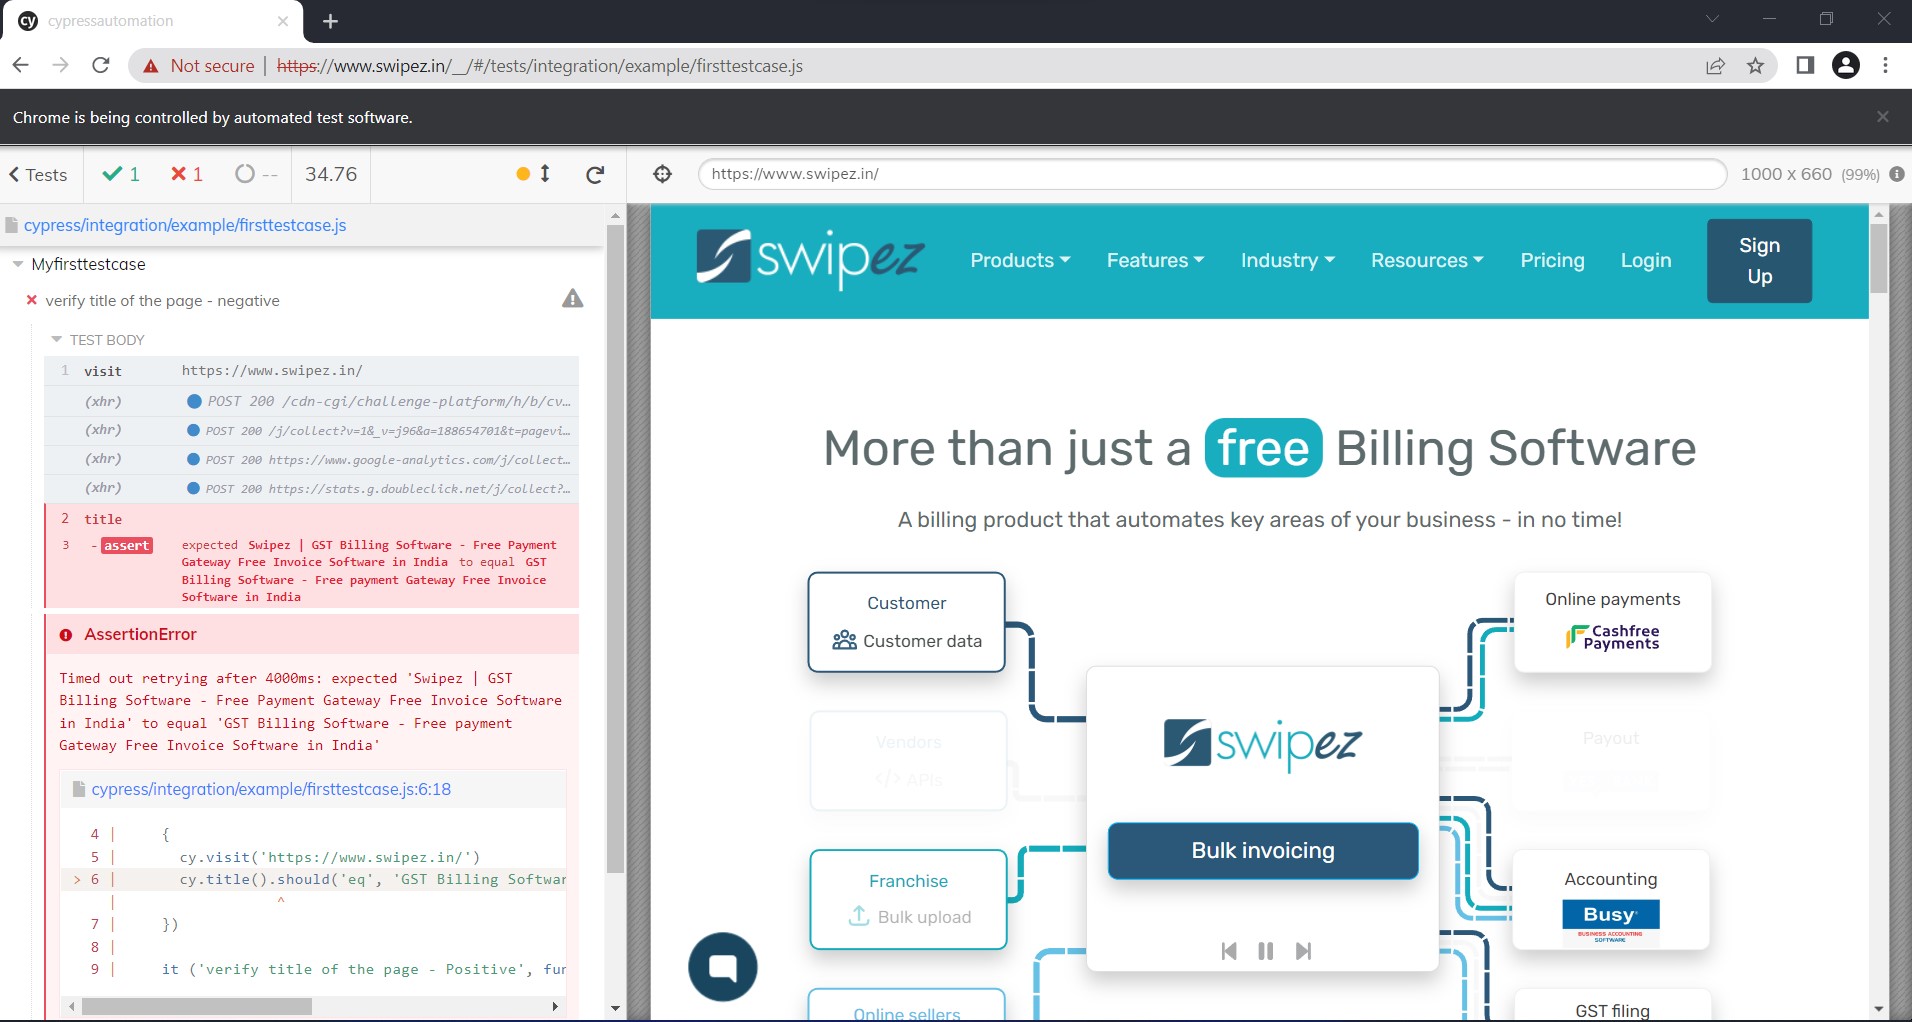
The title verification of Swipez is automated here. With two test cases listed—one positive and one negative—under the test framework.
Run test cases
Open the test runner through the terminal after saving the file. The test file will be displayed after you open the test runner; click on it to start the test.
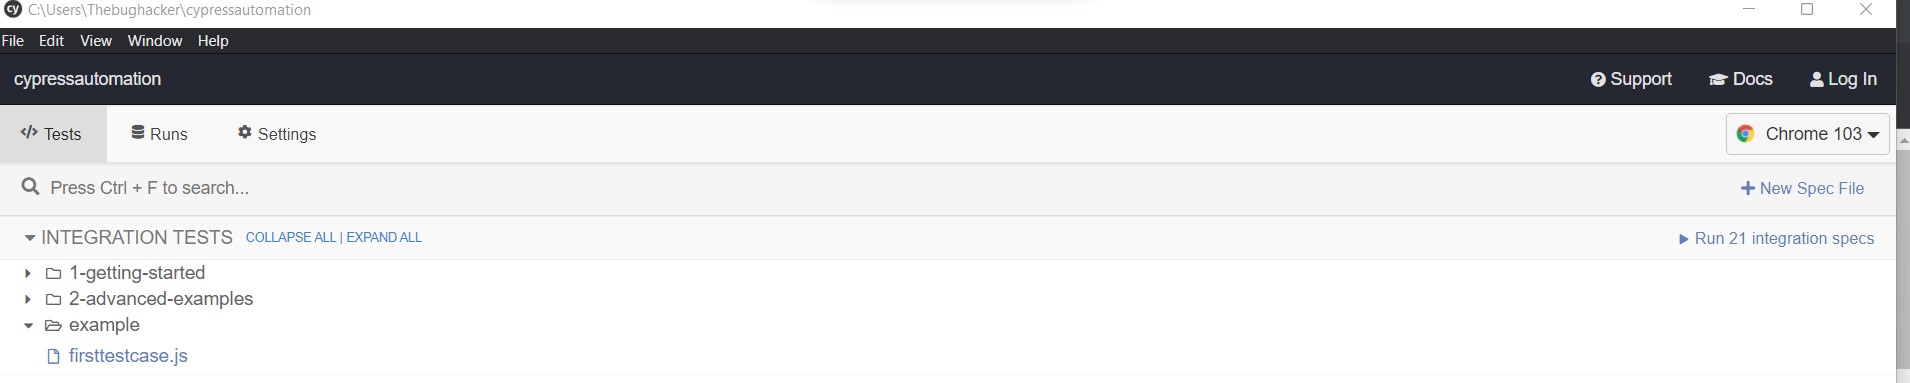
The test cases will run once you open the firsttestcase.js file.
Here's what a negative test case result would look like. If you enter the wrong title, an error message will appear highlighting the mistake.
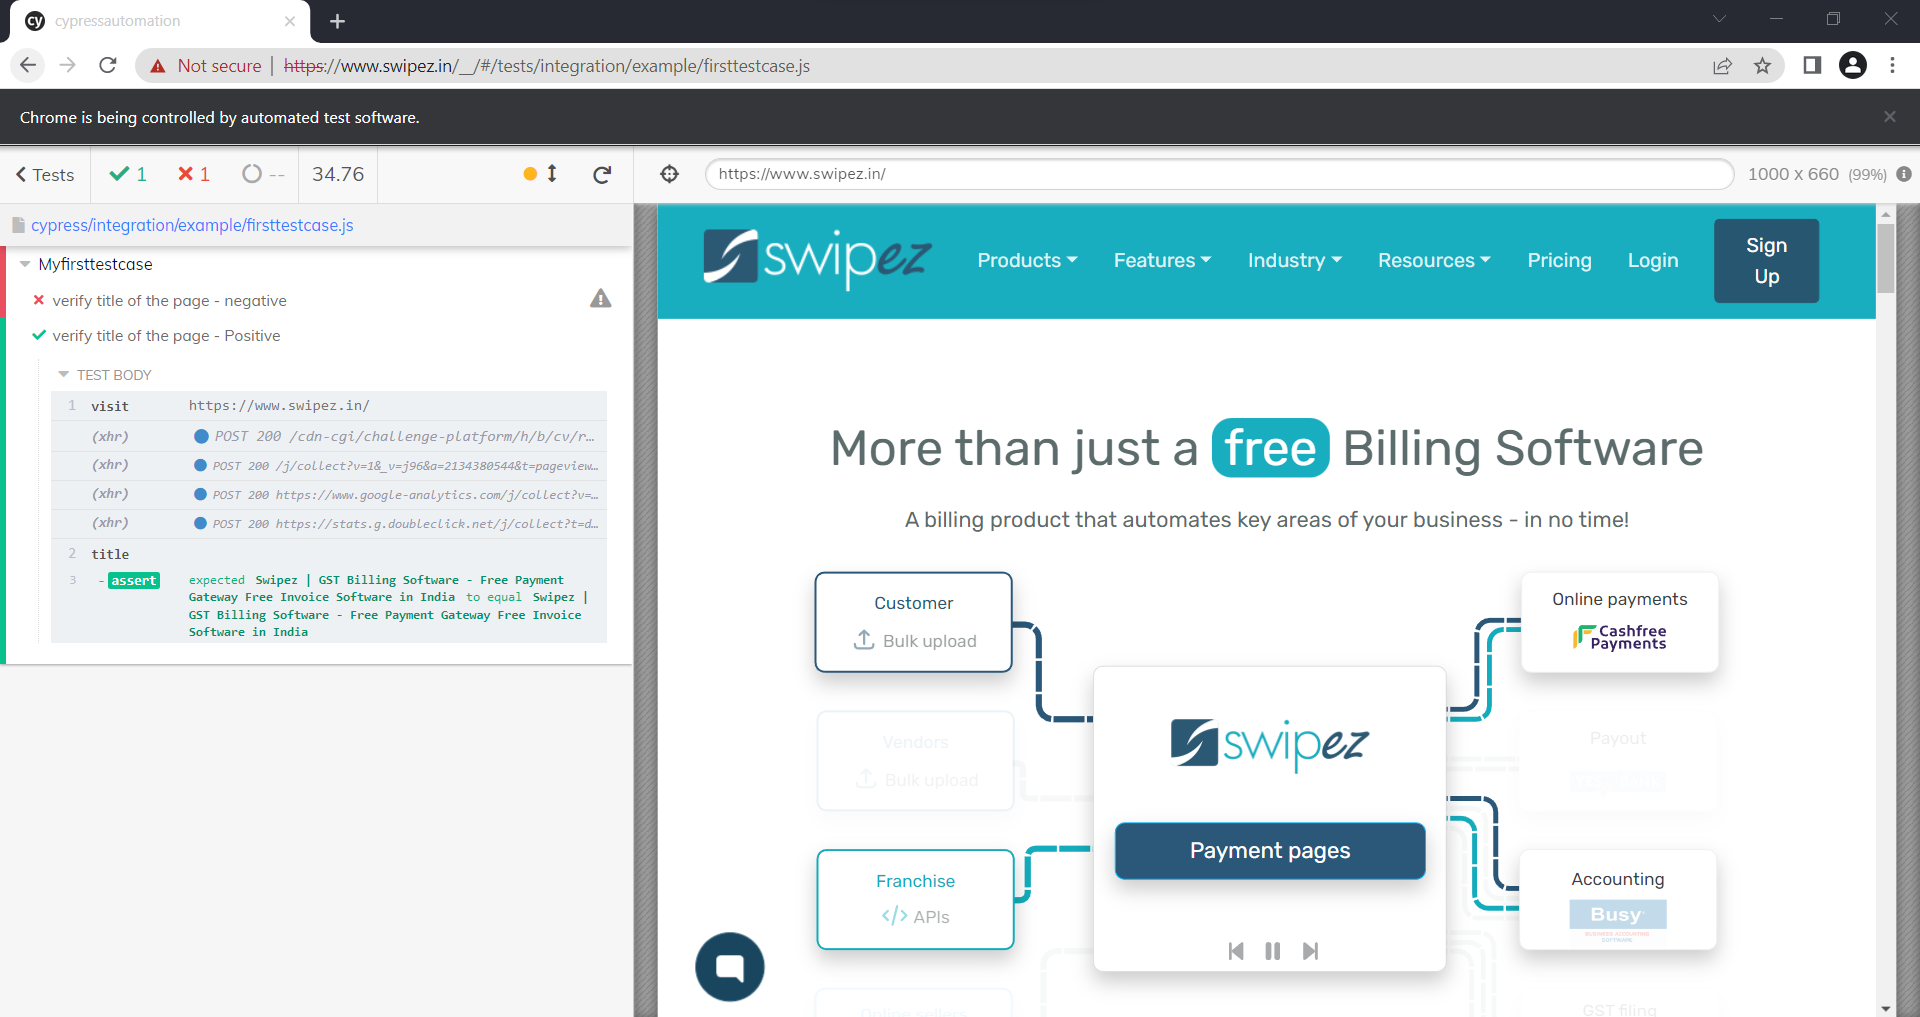
Here's what an error-free positive test case result looks like
Debugging
Here are a few examples of commands, debugging can be done with
- cy.log command, prints a message to the command log. For example: cy.log(‘Login successful’)
- cy.pause command will pause the test case execution, allowing you to interact with web applications directly. For example: cy.pause()
Similarly, you can resume the pause test case just by pressing the “Resume” button.
Also, you can go to the next command, by pressing the “Next” button.
- cy.debug command, lets to entry to the debugger, and offers the previous command yielded.
You need to have DevTools already open in the browser.
To stop the debugger you can use F12 to open it.